PASTAQ-GUI Tutorial
PASTAQ-GUI can be used to setup the parameters of PASTAQ’s DDA pipeline, enabling the users to easily pre-process projects with an user friendly interface. Note that this application is currently in beta and thus unexpected errors can occur.
When starting PASTAQ-GUI you will be greeted with the following screen:

The New project button will initialize a project in the given directory, creating a parameters.json file. This directory will also be used as the output directory of the pipeline.
With the Open project button, a parameters.json file can be loaded. This parameters file is the same that is generated in the output directory when the DDA pipeline is run from the GUI or using the Python bindings. This enables loading past projects even when the GUI was not used.
Once a project is active we can edit the project name and description and have access to the rest of the parameters. Setting up the project name and description is optional but recommended to have some context about the analysis for the future.

The first step would be to add some samples in mzXML or mzML format using the Add button in the Input files tab. Multiple files can be selected at once in the file explorer.

Selecting multiple samples and pressing the Edit button allow us to change the sample group and add identification files in mzIdentML format. For example, in a control vs disease experiment, mark the samples from each group accordingly.

If multiple input files are selected when assigning the identification files, they will be matched by the file name without the extension. For example 1_1.mzXML will be matched with 1_1.mzid. This allows selecting all identification files in a directory and letting the auto-match do the work instead of manually assigning each identification file to the mzXML/mzML raw data.

Repeat this for all sample groups as needed.

Next, switch over to the parameters tab to configure the pre-processing settings. The default parameters should be a good starting point, but the user must adjust the Instrument settings to match the type of mass spectrometer used, the resolution at the given m/z and the expected average FWHM of retention time peaks (in seconds).

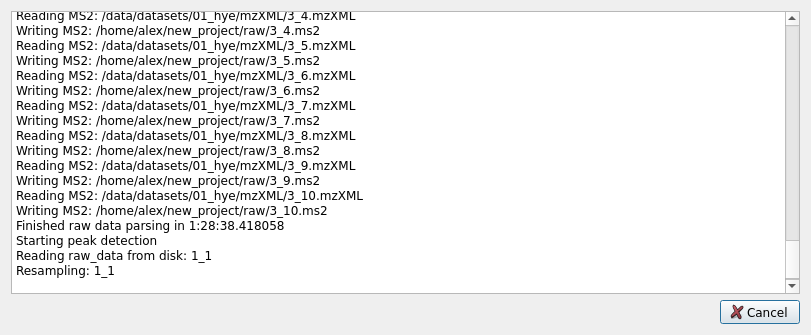
With this in place, the project can be saved. If pressing the Run button at the bottom of the screen the pipeline will be executed and the parameters will be saved automatically. The progress can be seen in the progress dialog pop-up, tracking each pre-processing. Note that while the pre-processing can be stopped at any time with the Cancel button, doing so when writing intermediate files to disk will result in corruption, and its not recommended. If this happens, deleting the corrupted files will result in those files being processed again in subsequent runs.

Once the pipeline has finished, the Ok button will appear, which is safe to press to dismiss the progress dialog. Now you should be able to see the output files in the project directory. We recommend looking at the quality folder to explore the quality control plots generated by the pipeline. The different quantitative tables can be found on the quant directory.