Perseus analysis of PASTAQ quantitative tables
PASTAQ output csv text files, which can be easily imported in Perseus. Here is an example of to process these quantitative tables with Perseus using a male/female serum dataset. The protein group quantitative data can be found in the protein_groups.csv table, and its corresponding metadata on the protein_groups_metadata.csv. The two files are linked with unique integer key located in the protein_group_id column.
Steps for Perseus analysis
Import data able
Perseus requires both data and metadata to be within the same table. To merge the quantitative and metadata tables from PASTAQ, we have a number of options described below. Import merged_protein_groups.csv file in Perseus using the “Generic matrix upload” command and include the quantitative columns as “main” and the protein name/description annotations as “text”.
Excel
Keys in the protein_group_id column are integer sorted in increasing value and starting from 0. Open the two files separately and copy and paste the annotation columns from protein_groups_metadata.csv in protein_groups.csv. Comparing the two columns with protein_group_id from both files can be used to check if there is a mismatch between rows. Finally remove one of the protein_group_id columns.
R script
data <- read.csv("protein_groups.csv", header = TRUE)
metadata <- read.csv("protein_groups_metadata.csv", header = TRUE)
merged_table <- merge(metadata, data, by = "protein_group_id")
write.csv(merged_table, file = "merged_protein_groups.csv", row.names = FALSE)
Python script
import pandas as pd

data = pd.read_csv('protein_groups.csv')
metadata = pd.read_csv('protein_groups_metadata.csv')
merged_table = pd.merge(metadata, data, on = 'protein_group_id')
merged_table.to_csv('merged_protein_groups.csv')
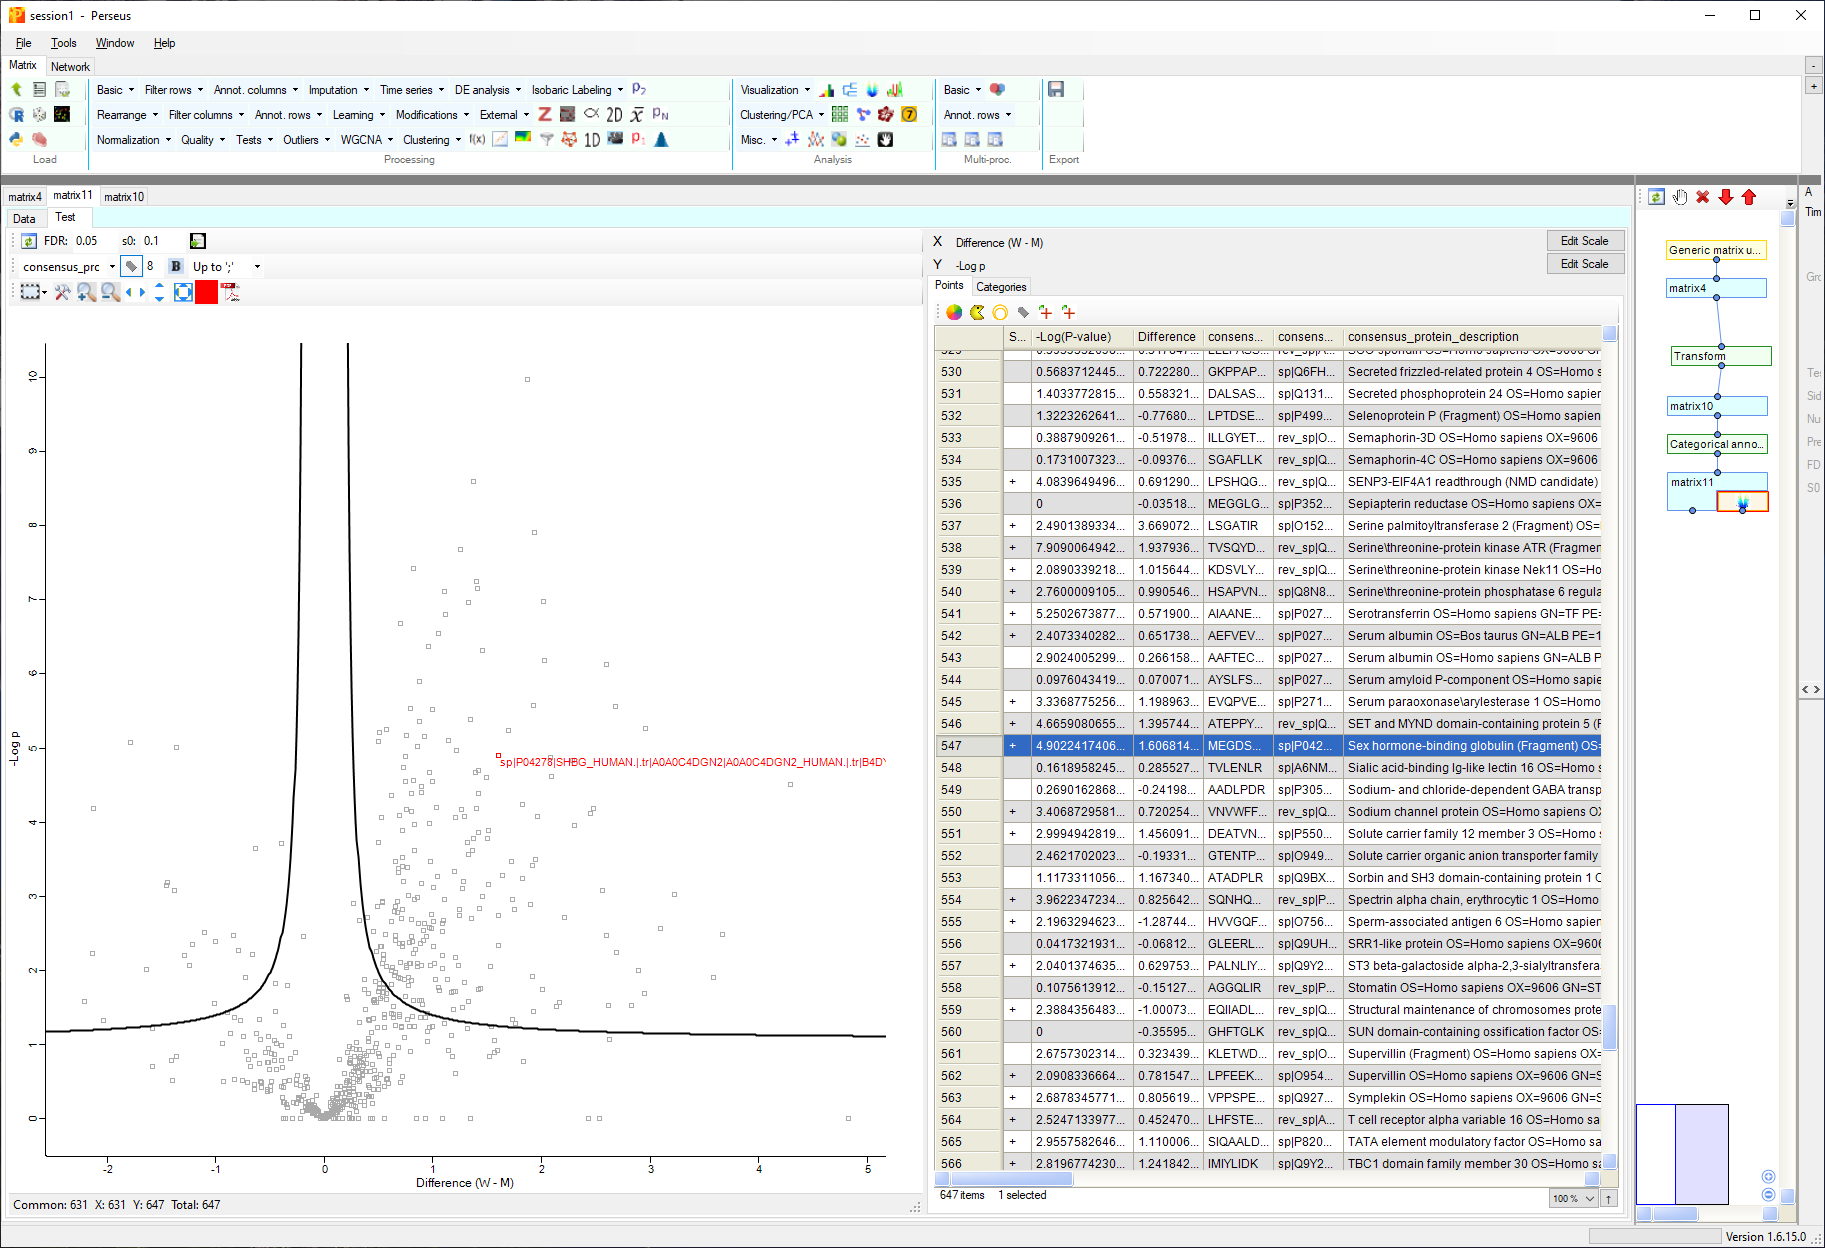
Perform a T-Text and volcano plot
Perseus can be used to perform a T-test and visualize the results as follows:
- Perform log2 transformation of the quantitative values.
- Create the grouping categorical variable for man and woman using
“annotation rows” -> “Categorical annotation rows”. - Perform Volcano plot analysis with t-test and gender as categorical variable with man and woman categories.
The output screen of this workflow is shown below.
